€12.4 million in additional revenue through A/B testing!

Watch for free now
New Study: How AI Search is Changing SEO Visibility in E-Commerce
Read now


Every online shop knows its conversion rate. However, the question that usually follows is the wrong one. "Are we above or below the market average?" sounds like a sensible way to gauge your position, but it rarely leads to better decisions.
The German e-commerce average is around 2.0 to 2.2 percent, depending on the study. While this figure is useful as a rough guide, it is hardly a benchmark for your shop because it ignores industry, price point, and traffic mix—the very factors that actually drive your rate.
This article provides both. First, the current 2025/2026 benchmarks, sorted by industry and device. Then, the question that actually moves the needle: Which metric do you really need to influence to grow, regardless of the market average?
1. What counts as a good conversion rate
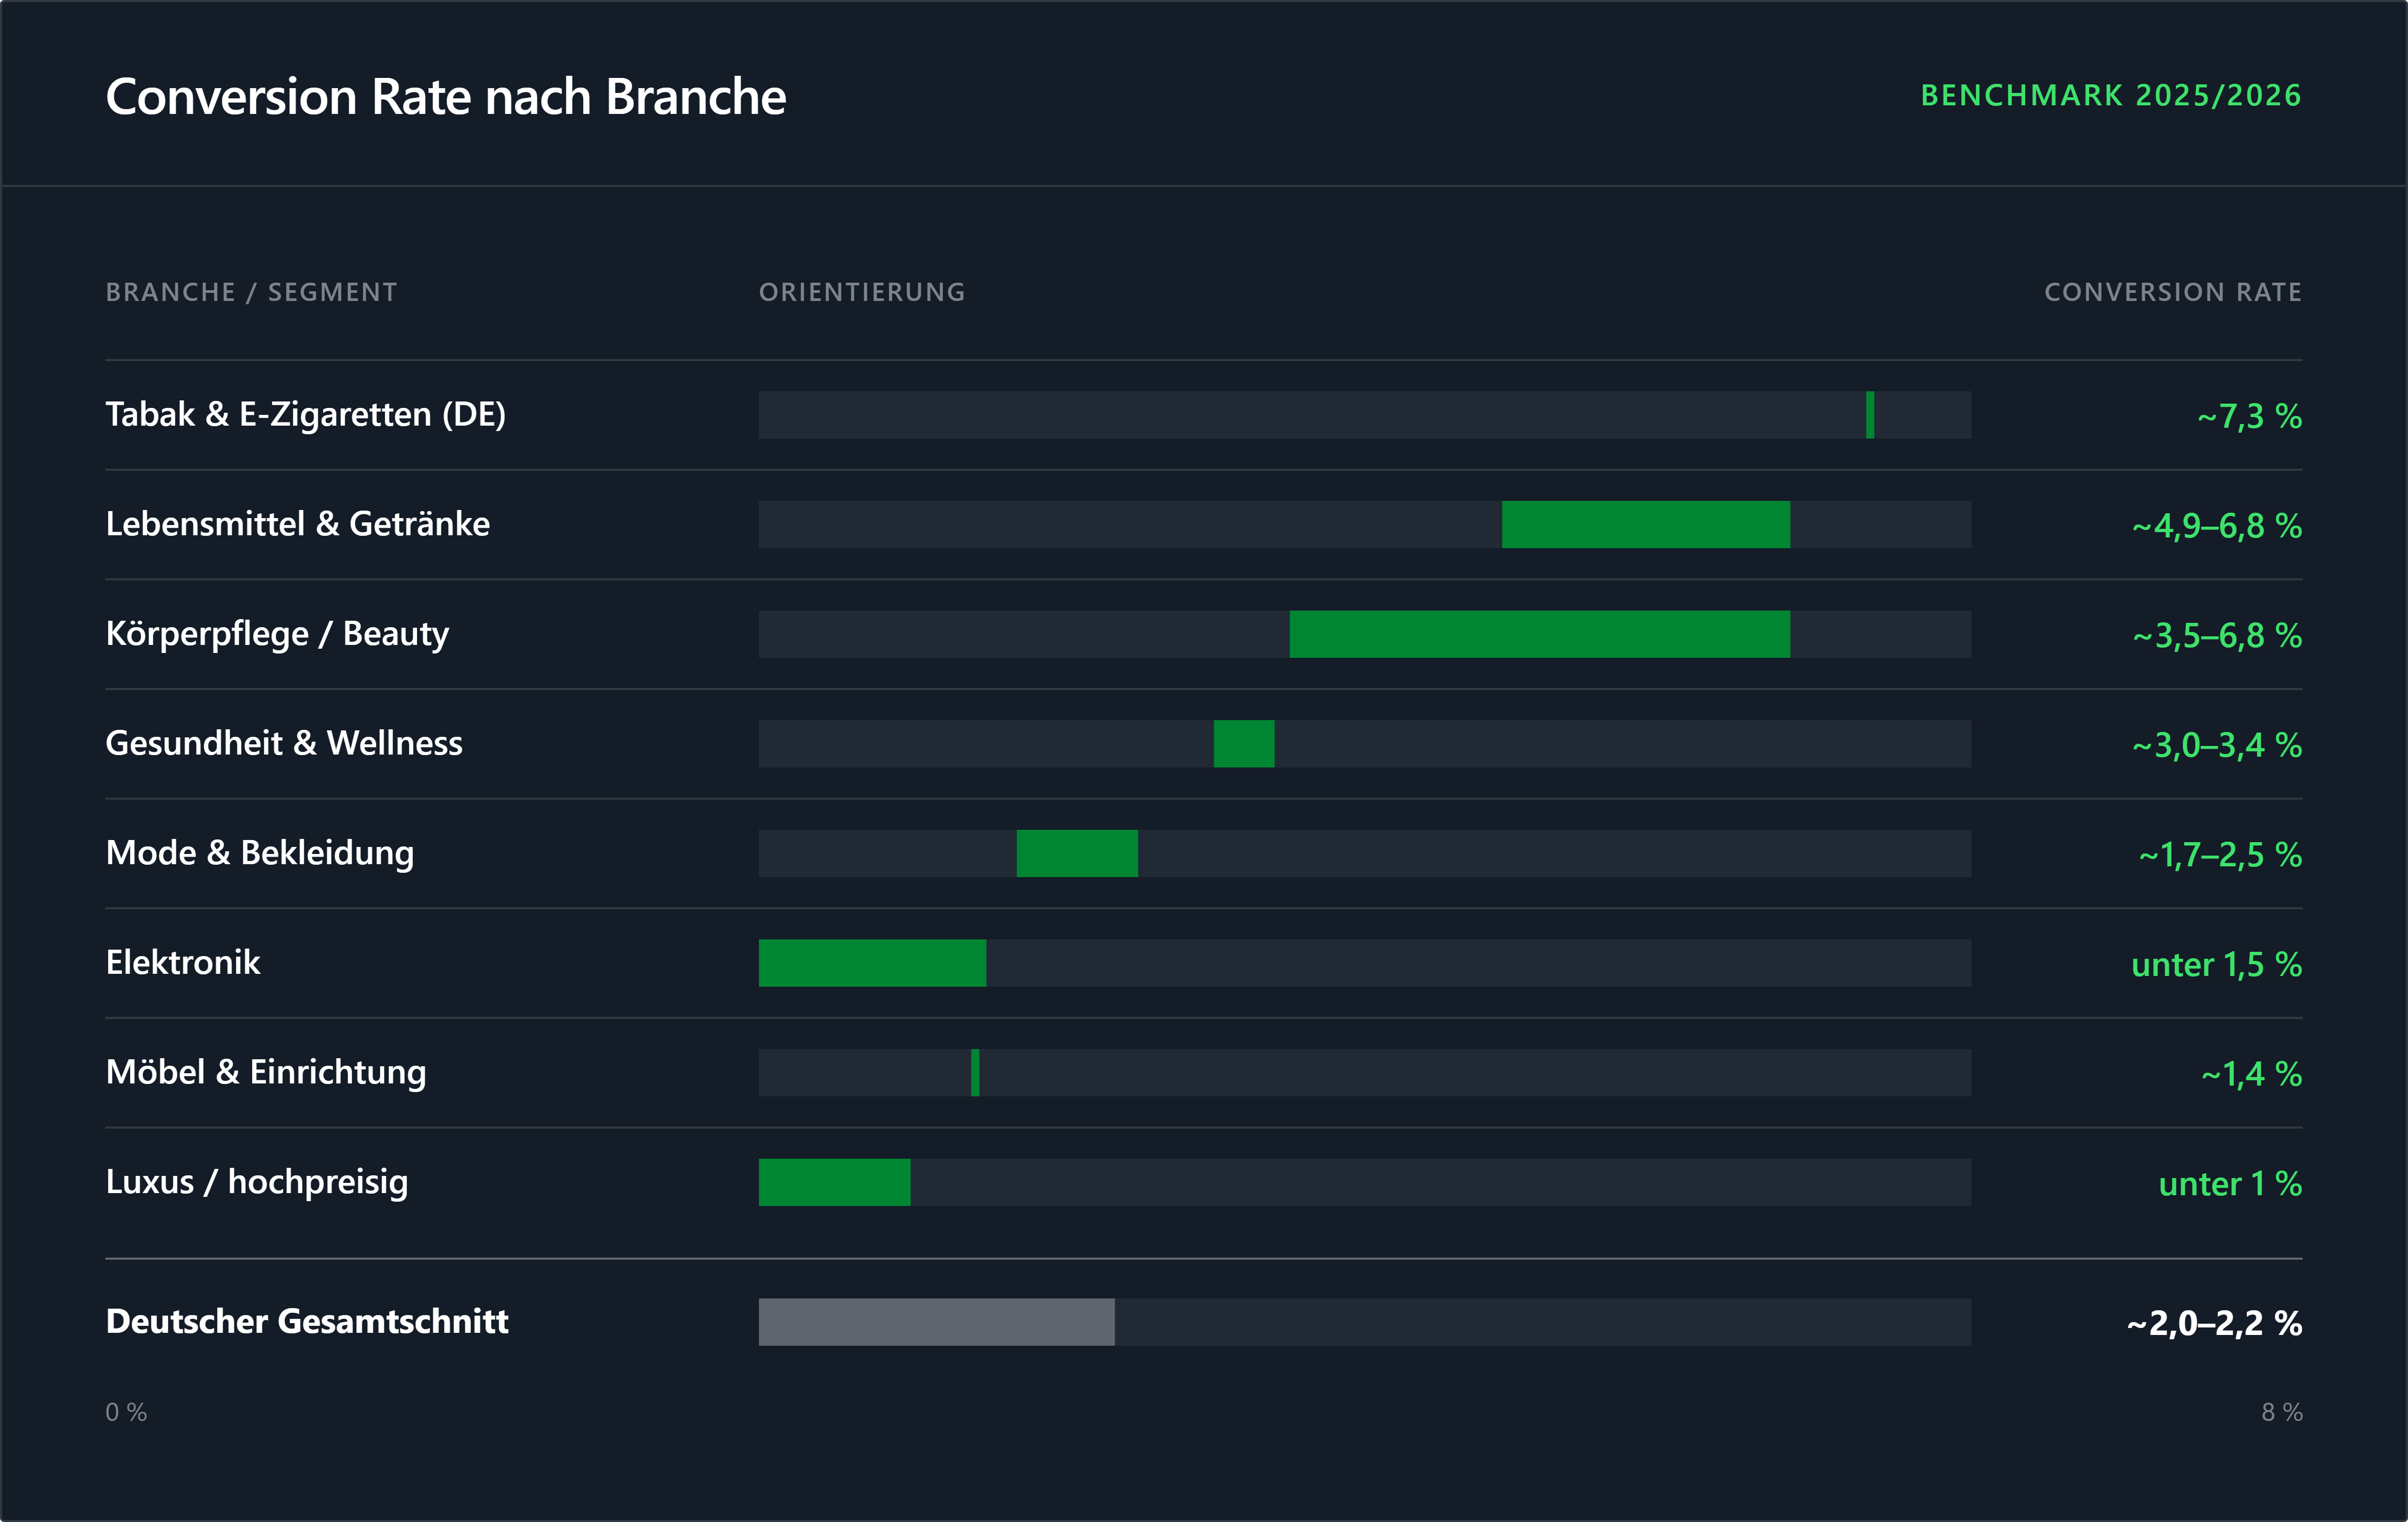
2. Conversion rate benchmarks by industry (2025/2026)
Key takeaways
"Good" is relative in e-commerce and depends primarily on your specific segment. An average German online shop typically sees a rate between two and two-and-a-half percent (the specific thresholds are in the box above). In a high-end segment, however, one percent might already be a good figure, whereas it would be well below average in the grocery sector.
Therefore, the comparison group is more important than the absolute number. A figure without industry and price context invites false conclusions, both high and low.
A quick note on measurement: For benchmark comparisons, the session-based conversion rate is the standard, as most studies use this metric and Google Analytics 4 uses it by default. The calculation method and further details can be found in the FAQ.

The following benchmarks are derived from several public surveys conducted between 2024 and 2026 (sources listed at the end of the article). Because these studies reflect different methodologies and regions, these figures should be viewed as general ranges rather than absolute values.
The pattern follows a simple rule: the lower the price and the shorter the consideration time, the higher the conversion rate. Everyday products are purchased quickly and with little risk. High-end electronics or expensive furniture require research, price comparison, and trust, resulting in lower conversion rates, though typically with a higher average order value.
The shop system also correlates with the rate, usually because it is linked to maturity and product range. A meaningful comparison should always take place within your own industry and price bracket to minimize the number of deviating variables. Any other approach rarely produces reliable results and often leads to poor decision-making, where the desired uplift fails to materialize.
A benchmark is only as good as its context, and that context has recently shifted. In our study with SISTRIX, the share of organic traffic in the total traffic of the 2,496 largest German online shops fell from 42.5 to 33.3 percent. When fewer visitors arrive via the most cost-effective channel, every remaining visitor must be worth more. Consequently, the conversion rate is no longer just an optimization metric; it is a matter of margins. How many shops are actively working on this? 76 percent do not use any testing tools.
The full analysis: AI & SEO E-Commerce Study 2026.
Even industry comparisons are only valid if certain factors are truly comparable. If these are ignored, even an industry-specific benchmark can quickly lead to a misdiagnosis.
Your traffic mix shifts every number. Visitors from email and organic search arrive with concrete purchase intent and convert significantly better than cold traffic from paid social. Two shops in the same industry can show very different rates based solely on their channel mix, even if both are performing equally well.
Desktop and mobile behave differently. Shops with a high volume of mobile traffic will see a lower overall average, even if the shop itself is not underperforming. Only by looking at each device separately can you identify where the real potential lies.
Consumer psychology also distorts comparisons. For high-priced products that require explanation, the ROPO effect (research online, purchase offline) and long decision-making processes come into play. Part of your website's impact does not show up in online conversions, and A/B tests in such markets require longer runtimes to produce valid results. Comparing such an industry to an impulse-buy segment is comparing two completely different purchasing situations.
.png)
A benchmark tells you where you stand in the field, but it doesn't show you the way forward. Furthermore, there is a fundamental limitation: those who align themselves with the competition are orienting themselves toward the competition's past and, at best, copying what already exists. A competitive edge comes from your own measurable progress.
The growth-relevant metric is therefore the uplift you generate in your own shop. The gap to the market average says little about this. Two shops with an identical rate can be there for completely different reasons: one loses buyers at checkout, the other as early as the product page. No average value shows which of these causes applies to you. Only an analysis of your own funnel can do that.
The experience gained from over 4,000 A/B tests at LEAP shows how significant this lever can be when applied in a data-driven way: around 2.6 to 3.8 percent revenue uplift per successful test, which adds up over an ongoing program. In the strongest individual case, a client's total conversion rate increased by over 42 percent within one year. These figures are explicitly not a benchmark for you to measure yourself against. However, they do show what becomes possible once the focus shifts from comparison to your own continuous testing.
Takeaways
Before you compare your conversion rate with any figure, it is worth asking a more honest question: how systematically are you already improving it today?
You can estimate how much revenue is being left on the table between visits and purchases in your shop in just a few minutes. The CRO Potential Calculator shows you the scale for your specific annual revenue. → Go to the CRO Potential Calculator
If you want to know exactly where this revenue is being lost, a free CRO potential analysis for your shop will show you.
What is a good conversion rate in e-commerce?
That depends on your industry, device, and price point. As a rough guide: 2.0 to 2.5 percent is a solid average, 3.0 to 4.0 percent is good, and anything over 4.5 percent is top-tier. In high-end segments, even 1 percent can be successful.
How do you calculate the conversion rate?
Conversion rate = (number of conversions divided by number of sessions) multiplied by 100. Session-based calculation is the standard for benchmarking.
Why is my mobile conversion rate lower?
Desktop structurally converts better than mobile (roughly 3.2 to 4.3 percent compared to 1.8 to 2.8 percent). A high share of mobile traffic lowers the overall average without the shop necessarily performing worse. That is why it is worth looking at each device separately.
Where can I find benchmarks for my industry?
Public surveys such as the Conversion Rate Report by uptain or global data from Contentsquare and IRP Commerce provide industry ranges. Make sure to compare values using the same measurement method and relevant region.
.png)


About one in four shoppers abandons their cart due to mandatory account creation. Here is how a guest checkout removes the barrier without losing customer accounts.

Most purchases are abandoned on smartphones. Discover where mobile checkouts fail and the levers you can use to boost your mobile conversion.

Around 7 out of 10 shopping carts are abandoned. Here are the known causes and the levers you can use to specifically lower your abandonment rate.

The cost of conversion optimization depends on a few key factors. Learn about pricing models, cost drivers, and why ROI is the more important figure.

Build SEO in-house or outsource to an agency? Five questions to help you make an honest make-or-buy decision.


.png)